Location intelligence.
The layer your decisions are missing.
We provide spatial evidence for site assessments, tender submissions, sustainability reporting and operational risk.
Four ways location intelligence pays for itself.
Our geospatial analysis follows our 7Cs framework providing verifiable spatial evidence for site assessments, public sector tenders, sustainability reporting, and operational risk management.
See the 7Cs →Why location intelligence works.
Location intelligence uses geospatial data — satellite imagery, environmental and social data, infrastructure information, and spatial modelling — to turn complex information into evidence for decision-makers.
Evidence you can stand behind.
Built on geographically referenced data with clear provenance and time stamps; verifiable and auditable.
Insight in its true environment.
We place assets, operations, and supply-chain nodes within their precise environmental, social and infrastructure contexts.
Change as it happens.
Historical baselines combined with near real-time monitoring give you a forward-looking view of exposure to future risk.
From one site to a portfolio.
Compare locations, aggregate findings, and align decisions across business units, regions, and reporting frameworks.
Complexity, decision-ready.
Advanced spatial analysis in clear, intuitive outputs: maps, models, and concise executive assessments a board can act on.
Assess Sites.
Screen for flood risk, nutrient neutrality, biodiversity net gain, and environmental constraints before you commit capital.
A stranded asset costs more than an assessment you skipped.
A site that triggers nutrient neutrality obligations, sits in Flood Zone 3, or sits on contaminated land after acquisition is a stranded asset. The cost isn't the assessment you didn't commission, it's the capital you committed without one.
Since February 2024 every major planning application in England requires a measurable 10% biodiversity net gain. NSIPs, including energy generation and transmission, from November 2026. Most developers still treat these as back-end planning conditions, not front-end acquisition filters.
The information exists. We analyse it before you write the cheque.
Location is the constraint.
BNG, nutrient neutrality, flood risk and EIA are all spatially defined obligations. Whether a site is caught by nutrient neutrality depends on its location within one of 27 sensitive catchments across 74 local planning authorities. The LNRS strategic significance multiplier is entirely location-dependent. None of these constraints show up in a standard legal pack; they require geospatial analysis.
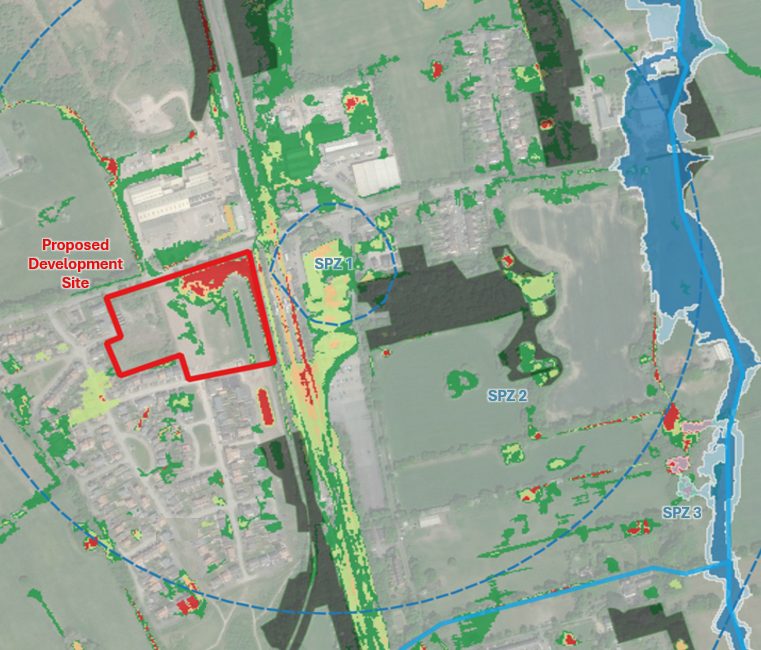
A site intelligence report.
Structured around your specific decision — acquisition, planning application, or investment appraisal.
Front-page summary of what the spatial evidence means for your decision, in language a board can act on.
Specific, prioritised actions tied to the evidence. What to do, in what order, and what to watch.
Intelligence Probability Yardstick applied to give you the confidence in your decision making.
Multi-layer spatial analysis: UKHab baseline, flood, nutrient catchment, designated sites, access and infrastructure context.
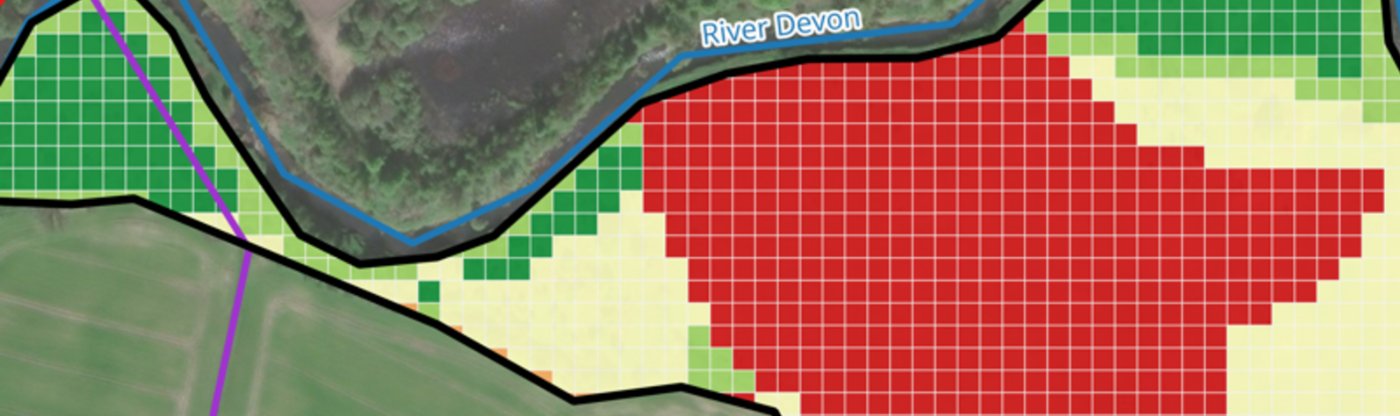
Woodland creation suitability — multi-layer framework.
Terrain and slope analysis, soil constraints, flood persistence modelling, peatland avoidance, and proximity to existing woodland — translated into clear investment guidance. Viable corridors identified; regulatory and ecological conflict zones excluded.
Want to screen a site before you commit?
Send us a postcode and we'll scope a Rapid Site Screen.
Get in touch →Questions we get asked.
A BNG assessment measures the baseline habitat value of a site using the statutory Biodiversity Metric 4.0 and UKHab classification. Since February 2024 all major planning applications in England must demonstrate a measurable 10% net gain in biodiversity, maintained for a minimum of 30 years.
An FRA is required for all development in Flood Zones 2 and 3, and for sites over 1 hectare in Flood Zone 1. The assessment must demonstrate the development will be safe for its lifetime, will not increase flood risk elsewhere, and incorporates sustainable drainage (SuDS) where appropriate.
Nutrient neutrality applies to new residential development in 27 river catchments across England where protected habitats are in unfavourable condition. Whether your site is affected depends entirely on location — 74 local planning authorities are currently affected.
At minimum: flood risk assessment, BNG baseline with habitat survey, and environmental constraints review. Sites in nutrient-sensitive catchments also need a nutrient neutrality assessment. A pre-acquisition screen identifies which of these apply before you commit capital.
We synthesise multiple geospatial datasets into a single decision-grade assessment with explicit confidence ratings. We don't conduct protected species or Phase 1 habitat surveys — we complement ecological consultants by providing a baseline BNG estimate, identifying nature corridors and enabling remote monitoring of site to demonstrate 30 year compliance.
Win Bids.
Strengthen public sector tender submissions with spatial evidence for social value, environmental benefit, and carbon reduction plans.
Generic narrative no longer scores.
PPN 002 requires a minimum 10% weighting for social value at award stage. It applies for all contracts worth more than £135k. PPN 006 requires a Carbon Reduction Plan for contracts above £5m per annum, the NHS requires one regardless of size.
Most contractors meet these requirements with the same language, the same commitments, the same lack of specificity. The difference between a winning bid and a losing one is more than just price. It's evidencing your understanding of the site-specific context.
Specificity scores. Postcodes are specific.
Deprivation indices are mapped at postcode level. Environmental benefit is measured at site level. Carbon reduction is calculated across your estate and logistics footprint. Generic assertions don't score. Spatially-referenced, verifiable evidence does.
A tender evidence pack.
Spatial analysis designed to strengthen the social value, environmental, and carbon reduction plan elements of your submission mapped directly onto public sector tender evaluation criteria.
The strongest spatial evidence available for your bid, structured to the ITT evaluation criteria.
Which evidence themes to lead with, where your spatial story is strongest, how to structure the narrative around the data.
PHIA applied — evaluators see your claims are grounded in a rigorous analytical framework, not aspiration.
Site adjacent deprivation mapping , environmental baseline, local employment geography, transport and emissions data.
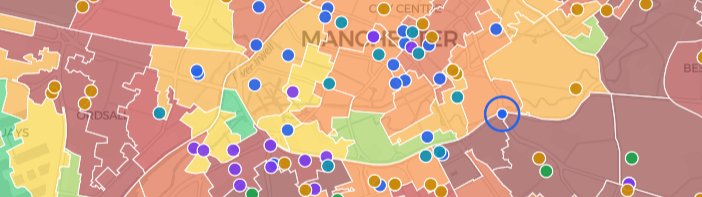
Social value mapping.
Deprivation indices at postcode level, access-to-services analysis, health and socioeconomic risk data, and site overlays against social need distribution. Where operations and investments intersect with vulnerable communities, and where targeted interventions deliver the greatest measurable impact.
Got a bid coming up?
Tell us about the contract, the evaluation criteria, and the timeline. We'll scope what spatial evidence can strengthen your submission.
Get in touch →Questions we get asked.
Procurement Policy Note 002 requires a minimum 10% weighting for social value at the award stage of central government contracts. Bids are scored against the Social Value Model — themes such as fighting climate change, reducing waste, improving the natural environment and tackling economic inequality. Spatially evidenced submissions consistently score higher than generic narrative.
Required under PPN 006 for suppliers bidding for UK government contracts valued at £5m+ per annum. Must cover Scope 1, 2, and a subset of Scope 3 emissions, with a commitment to net zero by 2050. NHS requires a CRP regardless of contract value. Credible plans score more highly.
Verifiable, location-specific data rather than generic assertions. Mapping deprivation indices at postcode level, quantifying proximity to communities with above-average unemployment, demonstrating measurable environmental benefit. Evaluators can see your claims are grounded in data, not just intention.
Construction contractors, infrastructure companies, FM firms, and engineering consultancies bidding for public sector contracts. We work with bid managers, social value leads, and sustainability teams to strengthen PPN 002 and PPN 006 responses.
Evidence Reporting.
Evidence for UK Sustainability Reporting Standards (UK SRS), Carbon Reduction Plans (CRP), Energy Saving Opportunity Scheme (ESOS), Biodiversity Net Gain (BNG) and Taskforce for Nature-related Financial Disclosures (TNFD).
Frameworks no longer ask whether you have a policy.
They ask whether you can prove it. UK SRS S2 — mandatory for listed companies from January 2027 — requires climate scenario analysis grounded in physical risk data. S1 will follow for other sustainability issues. TNFD's LEAP framework starts with Locate. Meeting these standards and frameworks credibly requires you to report on your sites and facilities.
CRP and ESOS demand reductions in emissions and energy use. This requires an understanding of current operations with sites, supply chains and logistics all critical parts of the puzzle. Plans need to be evidenced with credible data that shows how mitigations can deliver impact.
Every framework now has a spatial dimension.
UK SRS S2 requires physical climate risk assessment — flooding, heat stress, water scarcity, subsidence — inherently site-specific. TNFD's Locate step is a geospatial exercise by definition. BNG reporting under the Environment Act requires spatially referenced habitat baselines.
The evidence that underpins credible reporting isn't found in spreadsheets. It's found in the spatial relationship between your assets, your operations, and the environmental and social context they sit in. Everything happens somewhere.
The evidence layer your disclosures need.
Structured to align with the specific framework(s) you're reporting against — UK SRS S1 and S2, TNFD LEAP, PPN 006, or BNG.
What the spatial evidence says about your climate risk exposure, nature interface, or environmental performance in plain language.
Where the evidence is strong, where it needs strengthening, what mitigations to apply and what spatial monitoring would improve future reporting cycles.
PHIA Yardstick applied to every assessment — an explicit confidence layer most competitors and internal teams cannot provide.
Site- and portfolio-level analysis covering physical climate risk (UK SRS S2), nature dependencies (TNFD LEAP), emissions geography (ESOS), biodiversity baselines (BNG).
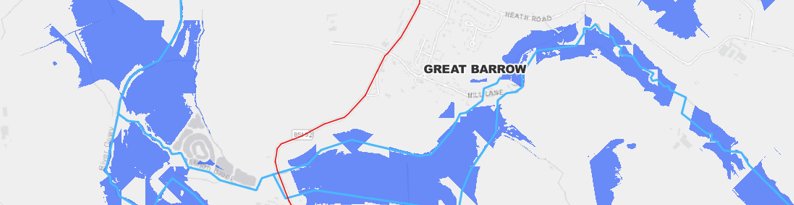
Cheshire Wildlife Trust

LiDAR-derived terrain modelling — river catchment.
Floodplain connectivity, soil drainage characteristics, land-cover influence on runoff, infrastructure exposure overlays. Where floodwater can be safely retained, slowed, or redirected to reduce downstream risk.
What does your reporting need to evidence?
Tell us which frameworks you're reporting against and we'll scope the spatial evidence you need.
Get in touch →Questions we get asked.
UK SRS S2 requires climate-related disclosures covering governance, strategy, risk management and metrics. The spatial element is strongest in scenario analysis — organisations must assess flooding, heat stress, water scarcity and subsidence across operations and value chain. For multi-site organisations, this requires site-level physical risk assessment using geospatial data.
TNFD uses the LEAP approach: Locate, Evaluate, Assess, Prepare. The Locate step requires organisations to map where they interface with nature across operations, assets and supply chains — identifying which sites sit near protected habitats, water-stressed catchments or biodiversity-sensitive areas.
SECR requires large UK companies to disclose energy use, Scope 1 and 2 carbon emissions and an energy intensity metric. UK SRS goes significantly further — climate scenario analysis, governance disclosures, climate-related risks and opportunities. Both require site-level data for multi-site organisations.
Greenwashing risk arises when claims cannot be substantiated. MapHorizon reduces this risk by providing spatially referenced, reproducible analysis with explicit PHIA confidence ratings. Every claim can be traced back to its spatial data source, methodology and confidence level.
Manage Risk.
Operational risk assessment and supply chain risk mapping. See your geographic vulnerabilities before they cause disruption.
Operational disruption follows geography.
The depot that floods every winter. The supply route that fails when a key bridge is restricted. The distribution centre in a heat stress corridor. The supplier whose facility sits in a region exposed to water scarcity. These risks are knowable in advance — mapped, measured and monitored by public agencies and satellite systems every day.
But most organisations manage operational risk in spreadsheets and business-continuity plans with no spatial dimension. Likelihood and impact are directly correlated with location.
A risk assessment without geography is a guess.
Climate risk, infrastructure exposure and supply chain vulnerability are fundamentally geographic. A network's resilience depends on which routes cross flood plains, which depots are exposed to extreme heat, and which supply nodes sit in regions with deteriorating water availability. These aren't abstract strategic risks — they're physical, locatable, and quantifiable at the site and corridor level.
Your exposure, mapped and ranked.
Which parts of your network carry the highest geographic risk, and what the likely impact is.
Prioritised interventions: which risks to mitigate first, where to invest in resilience, what to monitor.
PHIA Yardstick applied to every finding. You know where the evidence is strong and where uncertainty remains.
Flood and surface water exposure, heat stress corridors, infrastructure dependency, supply chain geography, route-level vulnerability.
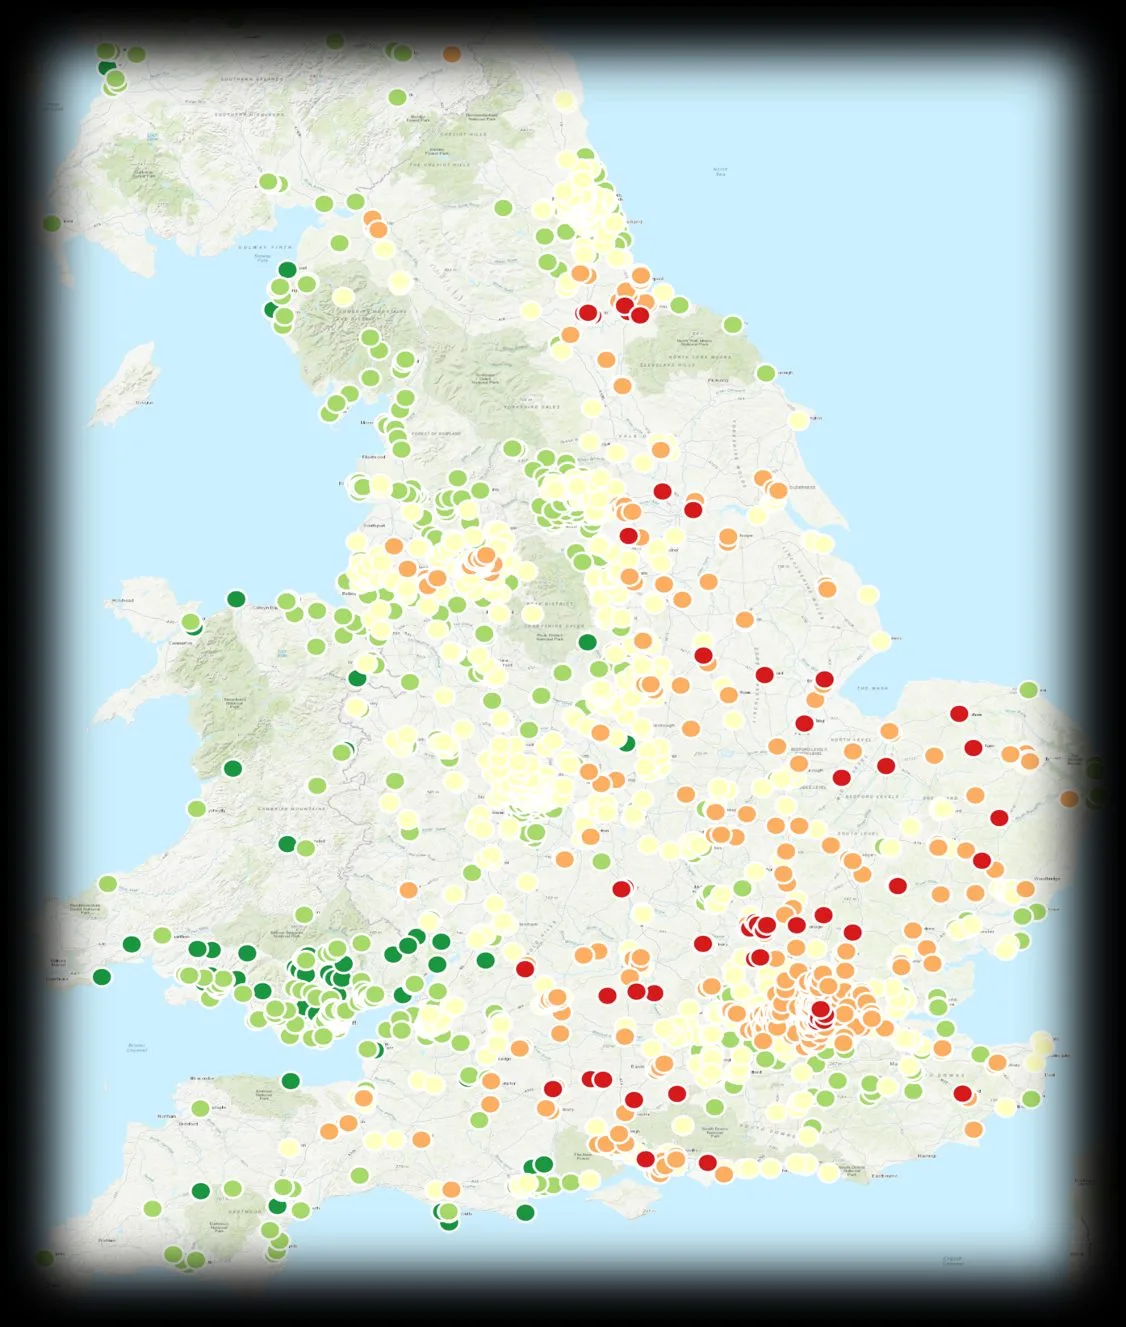
National food retailer - water stress analysis.
Local water supply stress, flooding and pollution risk and proximity to protected catchment datasets were combined into simple colour coded scores for every retail outlet location. This enables the business to identify where future problems might occur and where mitigations, such as Sustainable Drainage Systems, ought to be prioritised.
Want to know where your exposure is highest?
Tell us about your network and we'll scope an assessment.
Get in touch →Questions we get asked.
Supply chain risk mapping identifies the geographic exposure of your suppliers, logistics routes and distribution nodes to physical risks — flooding, extreme weather, water scarcity, infrastructure disruption. Overlay supplier locations against environmental and infrastructure risk data; prioritise resilience interventions.
Most BCPs identify what could go wrong but not where it's most likely to happen. Location intelligence adds the spatial dimension — which depots are in flood zones, which routes cross climate-vulnerable corridors, which supply nodes sit in water-stressed regions.
ESOS Phase 4 (qualifying December 2026, compliance December 2027) requires large organisations to audit buildings, industrial processes and transport. Site-level energy mapping, building portfolio assessment, and transport route optimisation are all geospatially driven.
It assesses route viability by modelling vehicle range against real delivery distances, maps charging infrastructure availability and gaps, and evaluates depot-to-destination topology. Identifies routes immediately viable for EV deployment and where infrastructure investment is needed.
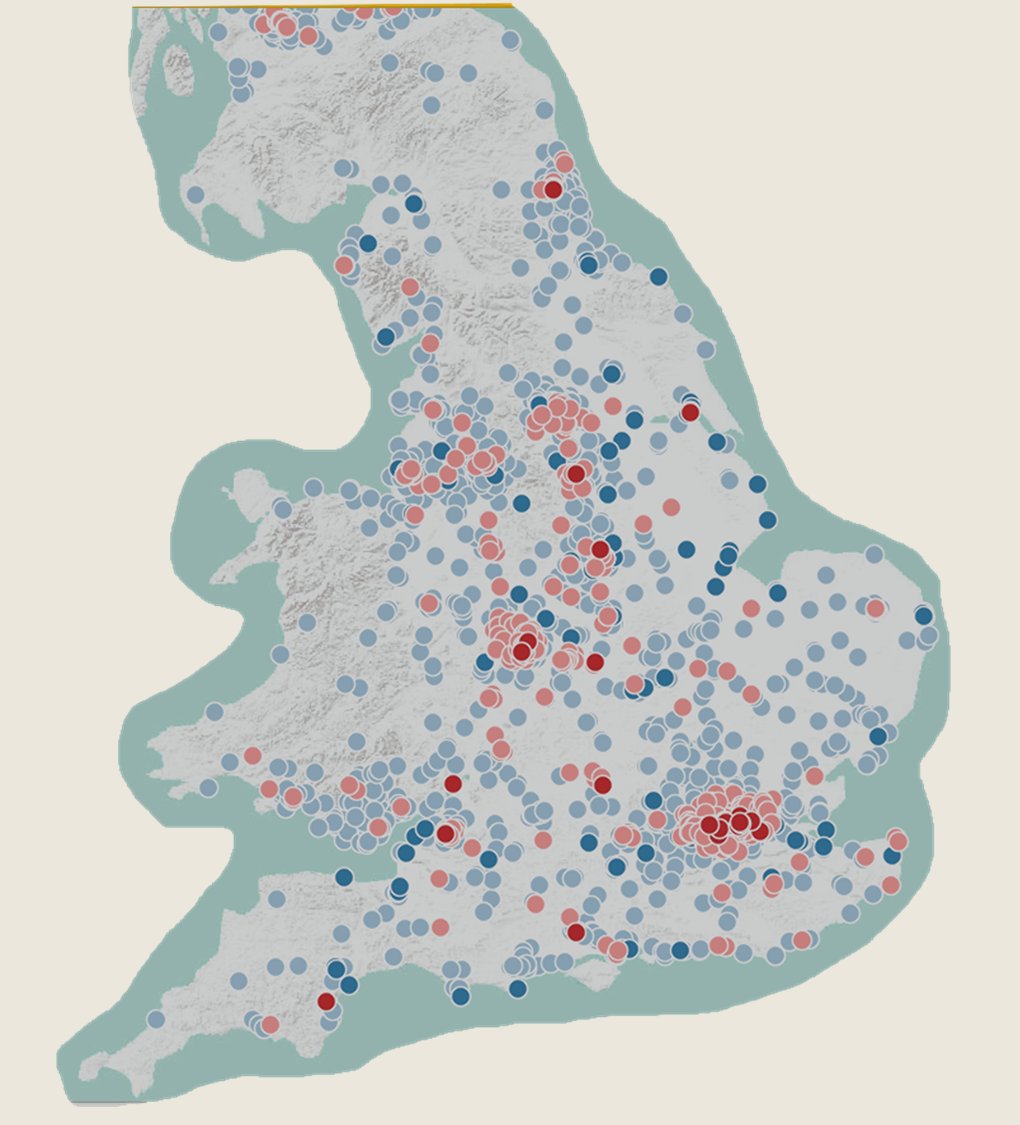
2,100+ sites. One national estate, analysed through a single spatial lens.
We built a portfolio-wide intelligence product for a national food retailer, integrating flood exposure, heat stress, water stress, deprivation overlays, and route-level vulnerability across the UK estate.
MapHorizon are location intelligence analysts founded in 2025 and based in Cheshire. We provide spatial evidence reports for construction developers, infrastructure companies, public sector contractors, and sustainability teams. Our services cover pre-acquisition site assessment, PPN 002 social value evidence for public sector bids, UK SRS and TNFD sustainability reporting, and operational risk mapping.
We were founded because we saw the same problem from two directions. Rupert spent years leading multi-discipline teams through complex projects and change programmes. He saw the issues created when spatial context was overlooked when assessing risk. Kyle shaped national geospatial strategy and led technical integration programmes through his extensive GIS knowledge. He saw how much spatial intelligence existed that never reached the people who needed it most.
Between us, we've spent over 35 years in geospatial intelligence including operational roles in Defence where the quality of spatial analysis directly influenced decision-making under pressure. That background shaped how we think about evidence: it must be accurate, traceable and delivered with explicit confidence in its reliability.
We turn complex environmental and social data into clear, site-level intelligence that helps organisations stay accountable, meet reporting standards, win bids, and plan for sustainable growth.
A sustainable planet where future generations can thrive supported by decisions grounded in context, transparency and impact.
Two former intelligence analysts. One standard of evidence.

Rupert Johnson
14 years as a British Army Officer. MBA, MSc Geospatial Intelligence, BSc Biology, Chartered Engineer. An experienced leader of highly specialist military intelligence teams, he has led the deliver of innovative solutions in high-stakes environments.

Kyle Roberts
20+ years in Defence GEOINT. Kyle has deployed on operations across multiple theatres, specialising in multi-source intelligence fusion and decision-support products for senior commanders. Unmatched GEOINT tradecraft.
We sit between raw spatial data and decision-quality evidence.
Analysts, not software vendors.
We don't sell data or a bland narratives. We provide intelligence products — structured assessments with clear recommendations, supporting evidence, and explicit analytical confidence.
We apply the PHIA Probability Yardstick.
Every spatial assessment carries a confidence rating across three axes: information availability, analytical rigour, and complexity and uncertainty. This is the same framework used by UK intelligence agencies. No other commercial geospatial consultancy does this.
Spatial intelligence, made accessible.
Our outputs are designed for non-technical decision-makers — board members, planning committees, procurement evaluators, compliance teams. You don't need GIS expertise to act on our work.
SME-accessible price points.
Military-grade analytical rigour doesn't require enterprise-scale budgets. We deliver decision-quality intelligence at price points that work for mid-market organisations. Site Intelligence Reports from £895 + VAT.
Seven principles that govern every assessment we deliver.
Our 7Cs are the analytical standard behind every output — from a Rapid Site Screen to a multi-site reporting deliverable. They define what good looks like, and how we hold ourselves to it.
Ready to see what location intelligence reveals about your sites, operations, or portfolio?
Send us a postcode, a bid reference, a framework you're reporting against — or just a sketch of the problem. We'll scope the spatial evidence from there.