Manage Risk.
Operational risk assessment and supply chain risk mapping. See your geographic vulnerabilities before they cause disruption.
Operational disruption follows geography.
The depot that floods every winter. The supply route that fails when a key bridge is restricted. The distribution centre in a heat stress corridor. The supplier whose facility sits in a region exposed to water scarcity. These risks are knowable in advance — mapped, measured and monitored by public agencies and satellite systems every day.
But most organisations manage operational risk in spreadsheets and business-continuity plans with no spatial dimension. Likelihood and impact are directly correlated with location.
A risk assessment without geography is a guess.
Climate risk, infrastructure exposure and supply chain vulnerability are fundamentally geographic. A network's resilience depends on which routes cross flood plains, which depots are exposed to extreme heat, and which supply nodes sit in regions with deteriorating water availability. These aren't abstract strategic risks — they're physical, locatable, and quantifiable at the site and corridor level.
Your exposure, mapped and ranked.
Which parts of your network carry the highest geographic risk, and what the likely impact is.
Prioritised interventions: which risks to mitigate first, where to invest in resilience, what to monitor.
PHIA Yardstick applied to every finding. You know where the evidence is strong and where uncertainty remains.
Flood and surface water exposure, heat stress corridors, infrastructure dependency, supply chain geography, route-level vulnerability.
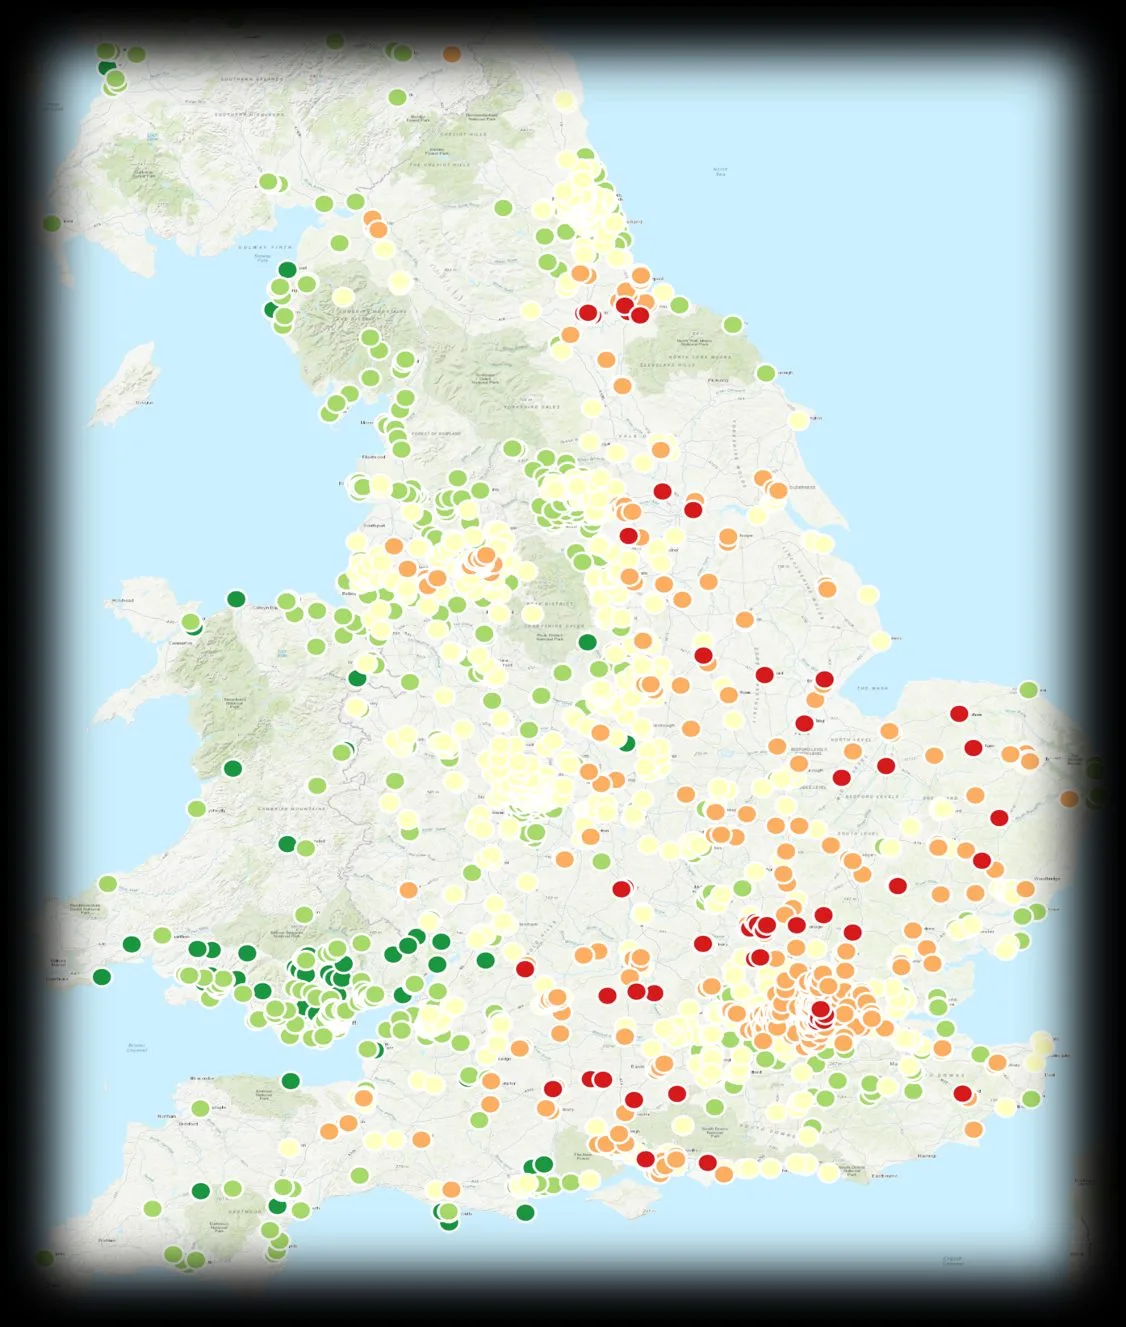
National food retailer - water stress analysis.
Local water supply stress, flooding and pollution risk and proximity to protected catchment datasets were combined into simple colour coded scores for every retail outlet location. This enables the business to identify where future problems might occur and where mitigations, such as Sustainable Drainage Systems, ought to be prioritised.
Want to know where your exposure is highest?
Tell us about your network and we'll scope an assessment.
Get in touch →Questions we get asked.
Supply chain risk mapping identifies the geographic exposure of your suppliers, logistics routes and distribution nodes to physical risks — flooding, extreme weather, water scarcity, infrastructure disruption. Overlay supplier locations against environmental and infrastructure risk data; prioritise resilience interventions.
Most BCPs identify what could go wrong but not where it's most likely to happen. Location intelligence adds the spatial dimension — which depots are in flood zones, which routes cross climate-vulnerable corridors, which supply nodes sit in water-stressed regions.
ESOS Phase 4 (qualifying December 2026, compliance December 2027) requires large organisations to audit buildings, industrial processes and transport. Site-level energy mapping, building portfolio assessment, and transport route optimisation are all geospatially driven.
It assesses route viability by modelling vehicle range against real delivery distances, maps charging infrastructure availability and gaps, and evaluates depot-to-destination topology. Identifies routes immediately viable for EV deployment and where infrastructure investment is needed.
Ready to see what location intelligence reveals about your sites, operations, or portfolio?
Send us a postcode, a bid reference, a framework you're reporting against — or just a sketch of the problem. We'll scope the spatial evidence from there.